
Explore the different ways to visualize rainfall data with our dashboard.Here are some examples:

This chart shows the total amount of rainfall for each year in the selected date range. It can help users understand the general trend of rainfall over the years.

This plot shows the amount of rainfall for each day in the selected date range. It can help users identify days with heavy rainfall, which may be useful for flood forecasting.

This plot displays the total amount of rainfall for each month in the selected date range. It can help users understand the monthly distribution of rainfall and identify any patterns or trends.

This plot helps to identify the frequency of rainy days for each month in a given time period.
1. Understand the data source, time period, and units.
2. View rainfall overview for summary information.
3. Check seasonal analysis for trends and patterns.
4. Adjust time period for analysis.
5. Compare data from different time periods.
6. Use filters to refine data analysis.
7.Interpret data for trends and patterns.
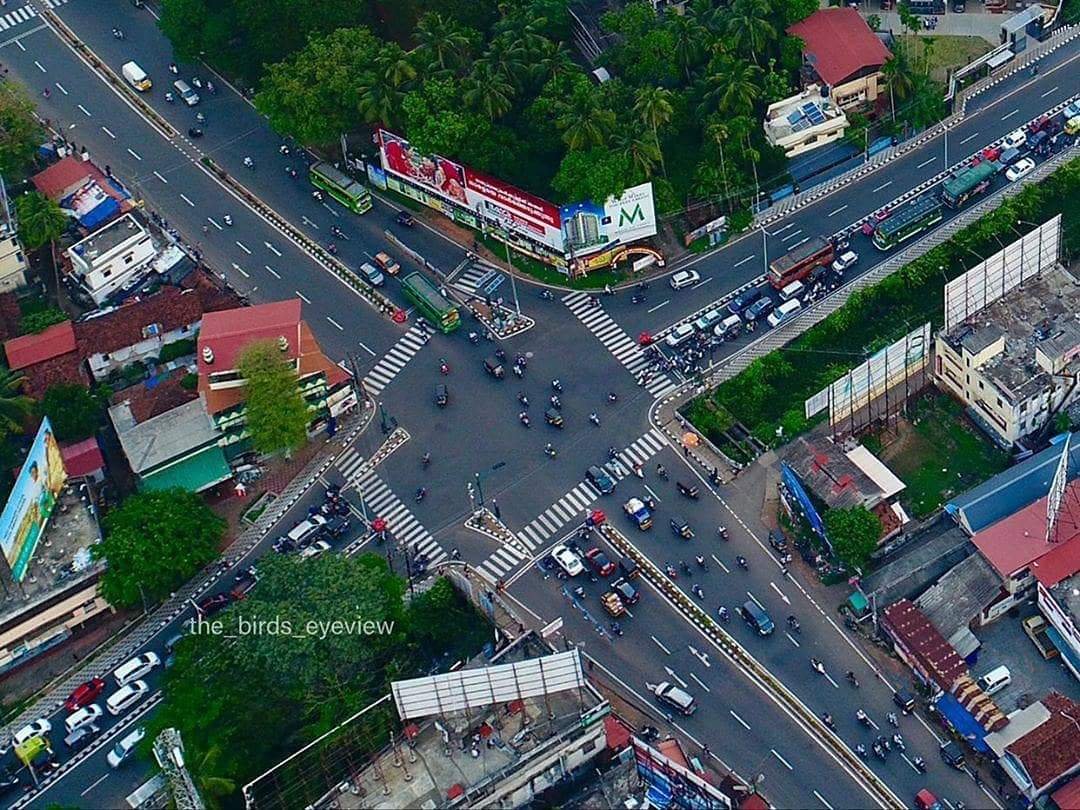
The selected study area of Kozhikode district in Kerala State, India, is located in the humid tropical region, which receives abundant rainfall of over 3000 mm annually, three times higher than the Indian national average. The district is situated between North latitudes 11° 08′ to 11° 50′ and East longitudes 75° 30′ to 76° 8′, covering parts of Survey of India Toposheets 58 A and 49 M. Kozhikode district is bordered by Kannur district to the north, Wayanad district to the east, Malapuram district to the south, and the Arabian Sea to the west. These factors contribute to the unique climatic conditions in the area, making it a vital region to monitor and analyze rainfall patterns.
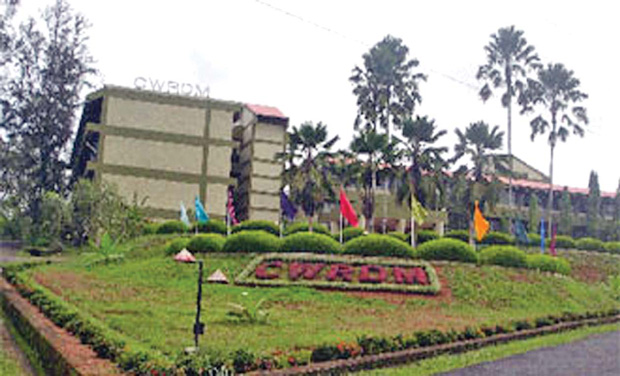
The Centre for Water Resources Development and Management (CWRDM) plays a critical role in managing water resources in Kerala, where rainfall patterns can be unpredictable and extreme. CWRDM's research and development activities aim to understand the impact of rainfall on water resources, develop sustainable water management strategies, and provide technical support to government agencies and non-governmental organizations. CWRDM's hydrological and meteorological data collection and analysis systems provide valuable information on rainfall patterns, which can be used to forecast floods and droughts, and develop water conservation and management plans. CWRDM's expertise in water resources management, combined with its advanced research and development capabilities, makes it a valuable resource in addressing the challenges of managing water resources in a changing climate.