Documentation:
RAT-Kerala was developed as part of the RAT-Global tool that houses information on various reservoirs across the world, avaialble at: www.satellitedams.net
Primary Citations:
- Suresh, S., Hossain, F., Minocha, S., Das, P., Khan, S., Lee, H., Andreadis, K., and Oddo, P.: Satellite-based Tracking of Reservoir Operations for Flood Management during the 2018 Extreme Weather Event in Kerala, India, Remote Sensing of Environment, Vol 307, 2024, https://doi.org/10.1016/j.rse.2024.114149
- Minocha, S., Hossain, F., Das, P., Suresh, S., Khan, S., Darkwah, G., Lee, H., Galleli, S., Andreadis, K., and Oddo, P.:Reservoir Assessment Tool Version 3.0: A Scalable and User-Friendly Software Platform to Mobilize the Global Water Management Community, Geoscientific Model Development (In press), 2023, https://doi.org/10.5194/gmd-2023-130 .
- Das, P., S. Suresh, F. Hossain, V. Balakrishnan, Jainet P J, H. Lee, M. Laverde, K. Hosen, C. Meechaiya, P. Towashiraporn. Forecast Informed Reservoir Operations using a Satellite Based Framework for Mountainous and High Precipitation Regions: The case of the 2018 Kerala floods, ASCE Journal of Hydrologic Engineering, (In Review), 2024
- Das*, P., F. Hossain, S. Minocha, S. Suresh, G. Darkwah, K. Andreadis, H. Lee, M. Laverde, P. Oddo ResORR: A Globally Scalable and Satellite Data-driven Algorithm for River Flow Regulation due to Reservoir Operations, Environmental Modeling and Software, vol. 176, 2024, https://doi.org/10.1016/j.envsoft.2024.106026
- Darkwah*, G, F. Hossain, G. Holtgrieve, C. Seaton, D. Graves, H. Lee, P. Das, S. Suresh, S. Minocha, S, Khan, P. Oddo, Reconstruction of the Hydro-Thermal Behavior of Regulated River Networks of the Columbia River Basin Using Satellite Remote Sensing and Data-driven Techniques, Earth’s Future (In revision), 2024.
- Biswas, N., F. Hossain, M. Bonnema, H. Lee, F. Chishtie (2021). Towards a Global Reservoir Assessment Tool for Predicting Hydrologic Impacts and Operating Patterns of Existing and Planned Reservoirs, Environmental Modeling and Software, Vol. 140, 2021, https://doi.org/10.1016/j.envsoft.2021.105043
- Das, P., F. Hossain, S. Khan, N. K. Biswas, H. Lee, Thanapon P., C. Meechaiya, U. Ghimire, and K. Hosen. “Reservoir Assessment Tool 2.0: Stakeholder Driven Improvements to Satellite Remote Sensing Based Reservoir Monitoring.” Environmental Modelling & Software, 157, 105533, 2022, https://doi.org/10.1016/j.envsoft.2022.105533
How to use RAT 3.0 - Kerala Website interface
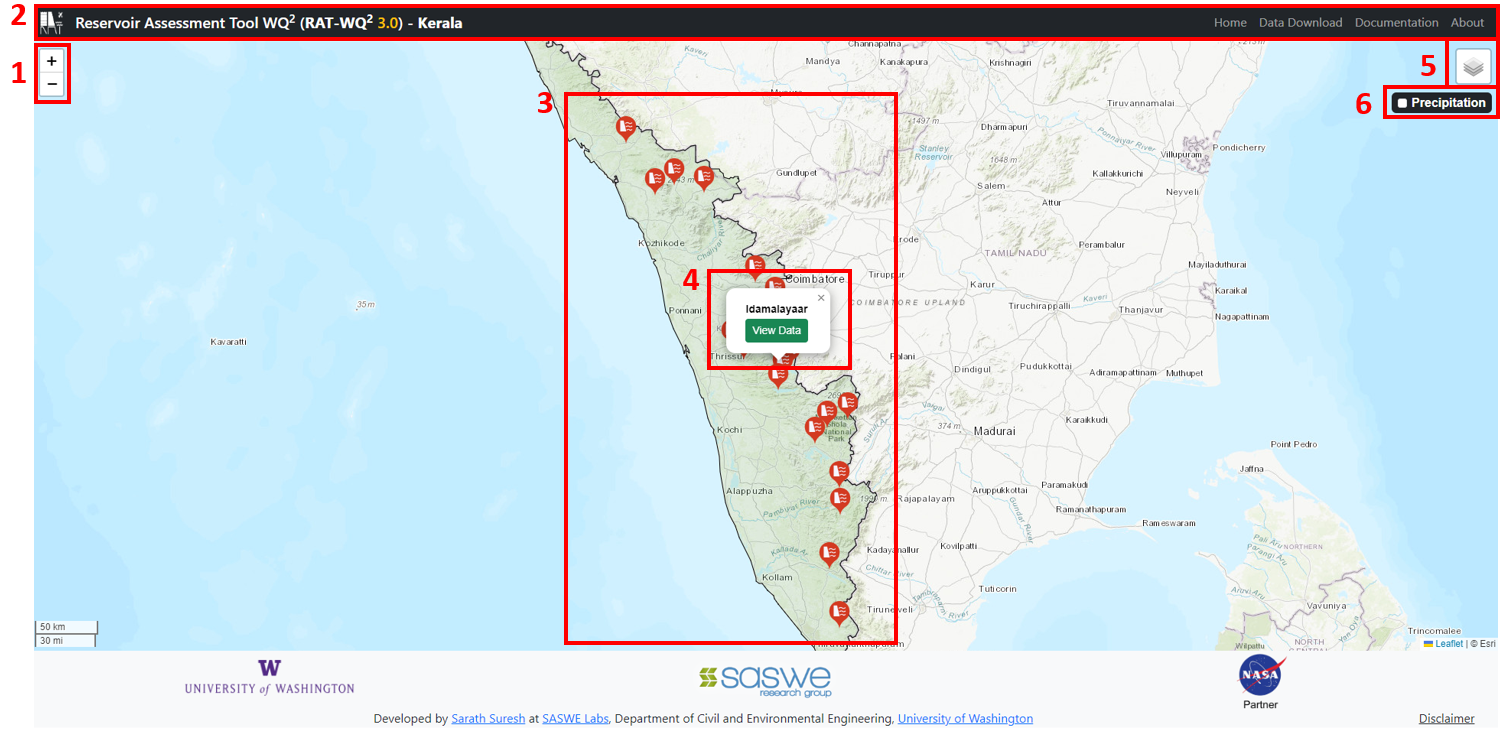
The landing page of the website contains the following elements and functionalities:
- Zoom controls: The + and - symbols can be used to zoom-in and zoom-out of the map.
- Navigation Bar: This sections contains links to the Data Download page, the Documentation, the About section, and a link back to the Home page. The RAT logo on the right takes the user to the RAT Global website.
- Dam Locations: The blue markers indicate the various reservoirs across Kerala that is currently available in RAT 3.0.
- Dam data: The markers when clicked displays the reservoir name along with a 'View Data' button. This can be clicked on to view the RAT data for the particular reservoir.
-
Map Layers: This toggle can be clicked to view the various map layers available. The user can toggle between the various basemaps by cliking on the corresponding
radio buttons
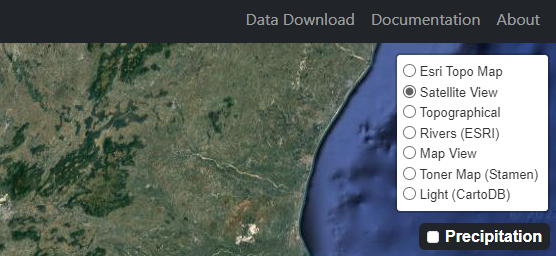
- Precipitation: When toggled, displays the distribution of rainfall over Kerala, for a selected date.
Reservoir Data
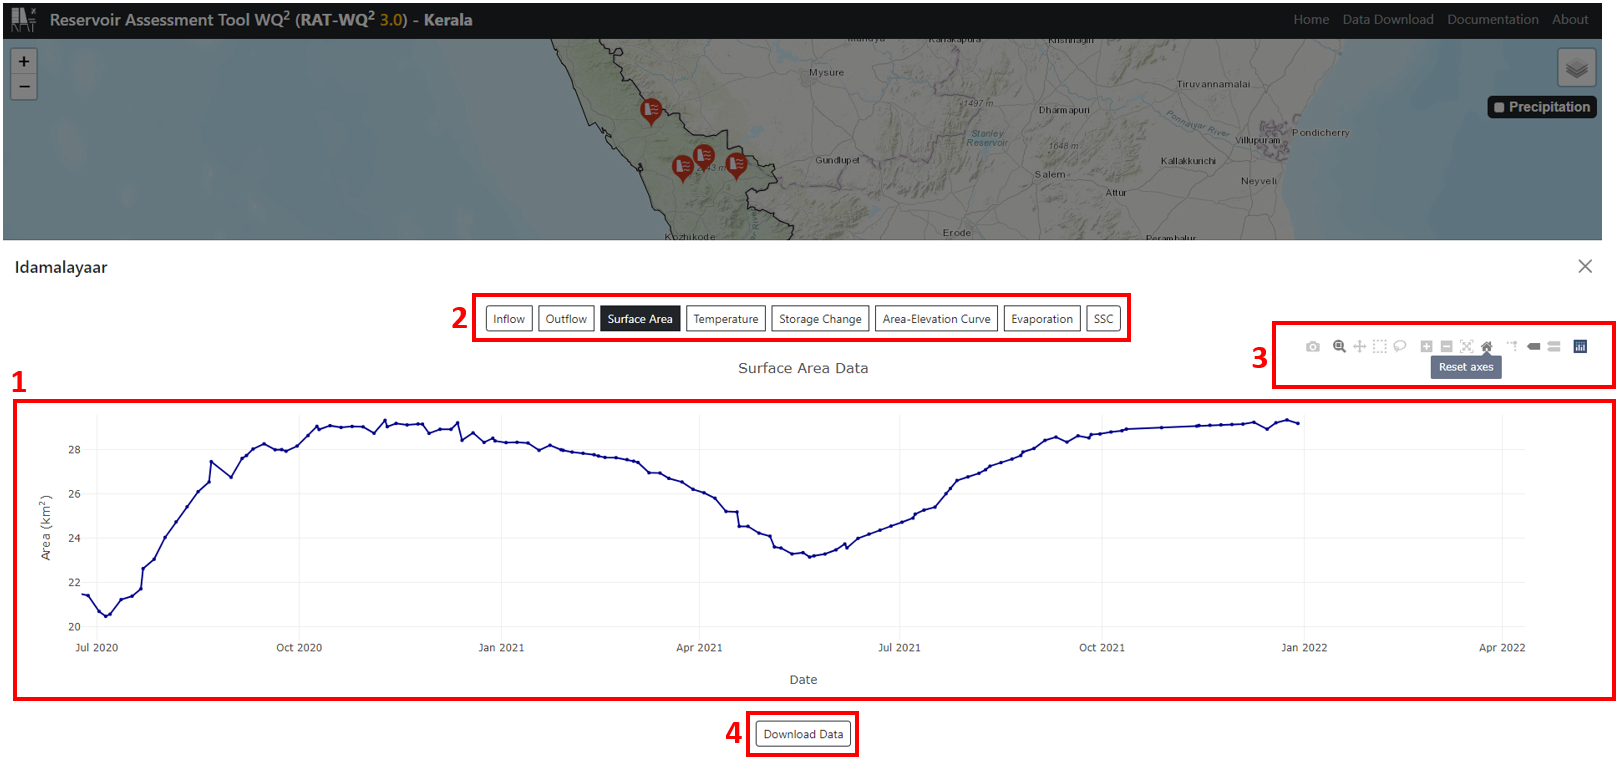
The Reservoir data screen contains the following:
- Plot Area: Displays the plot of the selected feature such as inflow, outflow, reservoir temperature etc.
- Plot selection: Users can click on the required feature to view the data on the plot area.
- Plot controls: Used to interact with the plot area. The controls provide options such as the ability to zoom in to parts of the plot, pan around the plot, save the plot as picture etc. The 'Reset axes' option can be used to restore the plot to its full size if it is in a zoomed-in state.
- Download Data: Users can click the button to download the data in a tabular format as .csv files.
Precipitation viewer
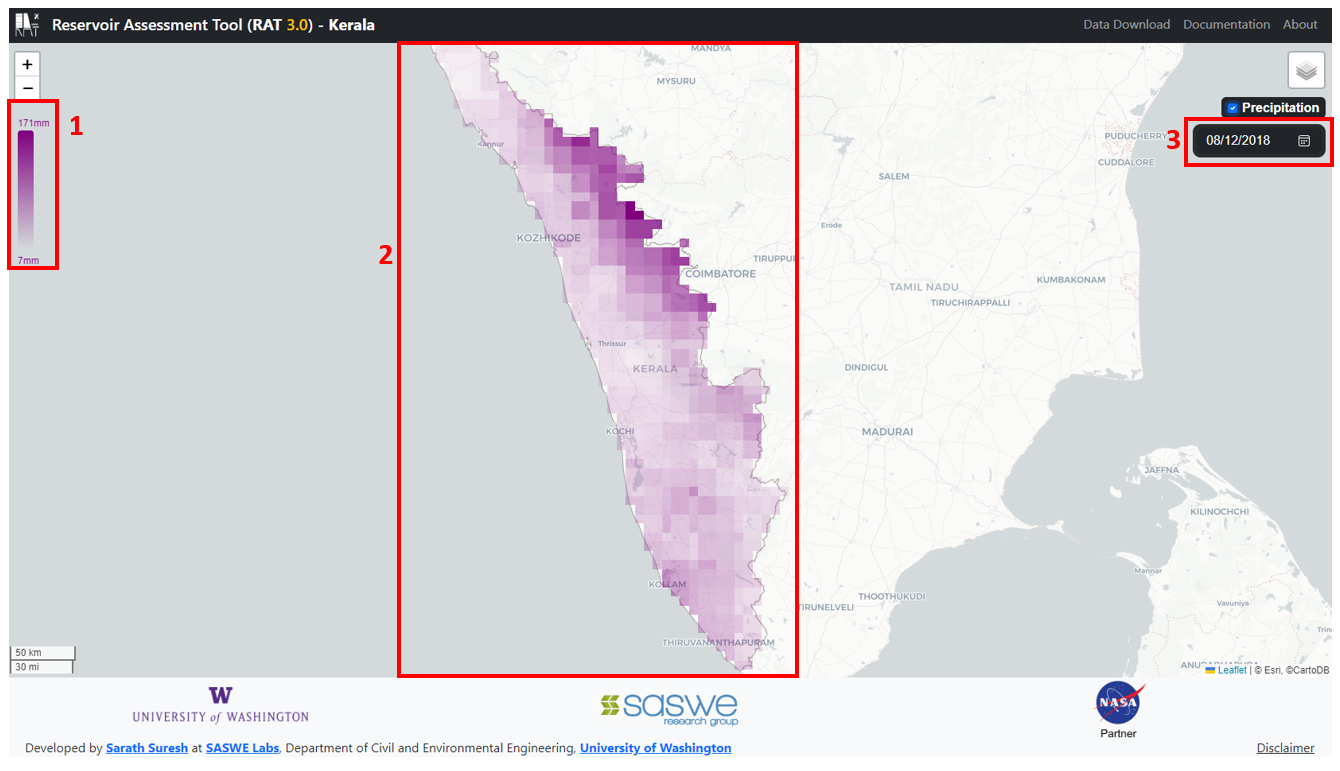
The precipitation screen contains the following parts:
- Legend: The colorbar indicates the mapping of the plotted colors with the intensity of the precipitaion.
- Precipitation Map: Shows the precipiation intensity over Kerala derived from the NASA: Global Precipiation Measurement (GPM) IMERG dataset at a spatial resolution of 0.0625° (~7km).
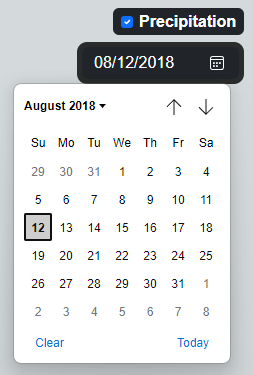
-
Date picker: User can select the date for which the precipitation is to be displayed by clicking on the calendar icon and
selecting the required date.